MDMoh DianMohammad Hassan Mohammadian · Realtor®
Menu
Plan your move↗
Mimico and Humber Bay Shores condo contextIslington-City Centre West condo context near Zorra Street

Etobicoke condo comparison · 2026

Islington–City Centre West was about 14–16% cheaper than Mimico after matching condo size and bedrooms. Marketability was much closer.

I compared REALM/PropTx sold Condo Apartment records for the same Jan. 1–Sep. 20 window in 2025 and 2026, then matched primary bedroom count and reported suite-size bands before interpreting the 2026 price gap.

316 Mimico sales · 2026270 Islington sales · 2026Apartment / 1 Storey-AptREALM / PropTxHistorical matched-period analysis

Choosing your Toronto west-end condo neighbourhood

Would you trade a Mimico waterfront location for a lower-priced Islington condo?

Picture a buyer searching for a two-bedroom condo in west Toronto. Mimico offers many waterfront-area choices while Islington–City Centre West offers a different location and building mix. The 2026 median completed-sale prices were $609,500 and $510,000 respectively. Even after matching bedrooms and reported size, the historical Islington price difference remained about 14.2%. But paying less does not automatically mean a better commute, lower monthly fees or faster resale. These are illustrative preferences, not statements about today's listings.

For a buyer balancing budget and location

A $99,500 difference between medians is only the beginning.

The raw 2026 gap between $609,500 Mimico and $510,000 Islington was around 16.3%. Matching bedrooms and size still left a roughly 14.2% price gap; however, neither figure means the same physical suite is always that much cheaper.

Next check: Compare your real commute, household needs, usable layout, maintenance, property taxes, parking and transit access for actual available condos. Then use same-building completed comparables to judge price.

Budget the full purchase cash requirement →
For a seller in either community

Price difference does not prove one area sells faster.

Historical 2026 median completed-sale time was about 28.5 days in Mimico and 27 in Islington. The study's matched liquidity uncertainty prevents calling a clear speed winner despite the meaningful price difference.

Next check: Compare the same bedroom-size group and corporation-level competition rather than implying one neighbourhood's entire resale market is more liquid.

Prepare for the full sale decision →

Make the choice on your exact needs

  1. Which actual unit offers the bedrooms, usable space, light, parking and commute your household needs?
  2. What is the complete monthly and closing cost of each condo after maintenance, taxes, insurance and financing?
  3. Does the historical gap reflect suitable like-for-like units, and is there enough evidence for claims about selling speed?

The unchanged Jan. 1–Sep. 20 REALM comparison of apartment-style condos uses 316 Mimico and 270 Islington completed sales in 2026. Reported size and bedroom matching do not control every building and location feature, and the liquidity findings do not show a categorical winner.

The answer in one minute

The price difference survives a much more like-for-like comparison.

The raw 2026 medians were $609,500 in Mimico and $510,000 in Islington–City Centre West—a 16.3% gap. Matching primary bedroom count with reported suite-size bands reduced the gap to about 14.2%. A stricter bedroom-and-den sensitivity came to about 15.5%.

$609.5KMimico 2026 raw median
$510KIslington 2026 raw median
~14.2%Matched price gap
28.5 vs 27Raw median DOM · days

Final public cohort: Apartment / 1 Storey-Apt only. Acquisition layers remain separately reconciled to 354 / 340 Mimico records and 309 / 282 Islington–City Centre West records.

What is robust?

Price: yes. A clear liquidity winner: no.

14.2%

Primary bedroom + reported-size matching still puts Islington materially below Mimico on 2026 sold price.

15.5%

Exact bedroom + den + reported-size sensitivity points in the same direction.

27 vs 28.5

Raw median DOM leaned slightly faster in Islington, but that is a much smaller distinction than the price gap.

Uncertain

Bootstrap intervals for matched DOM and 30-day sell-through cross zero. Marketability is too close to call categorically.

Matched calendar cohorts

Same dates. Same public property-style rule.

The public table keeps Apartment / 1 Storey-Apt Condo Apartment sales only. The underlying acquisition cohorts are retained separately so a style filter is never confused with the canonical REALM result count.

Community / periodSalesMedian soldMedian DOMSold ≤30dSold >60d
Mimico · 2025329$625,00027 days56.5%18.2%
Mimico · 2026316$609,50028.5 days52.8%21.5%
Islington–City Centre West · 2025296$552,00026 days57.4%14.5%
Islington–City Centre West · 2026270$510,00027 days57.4%21.1%
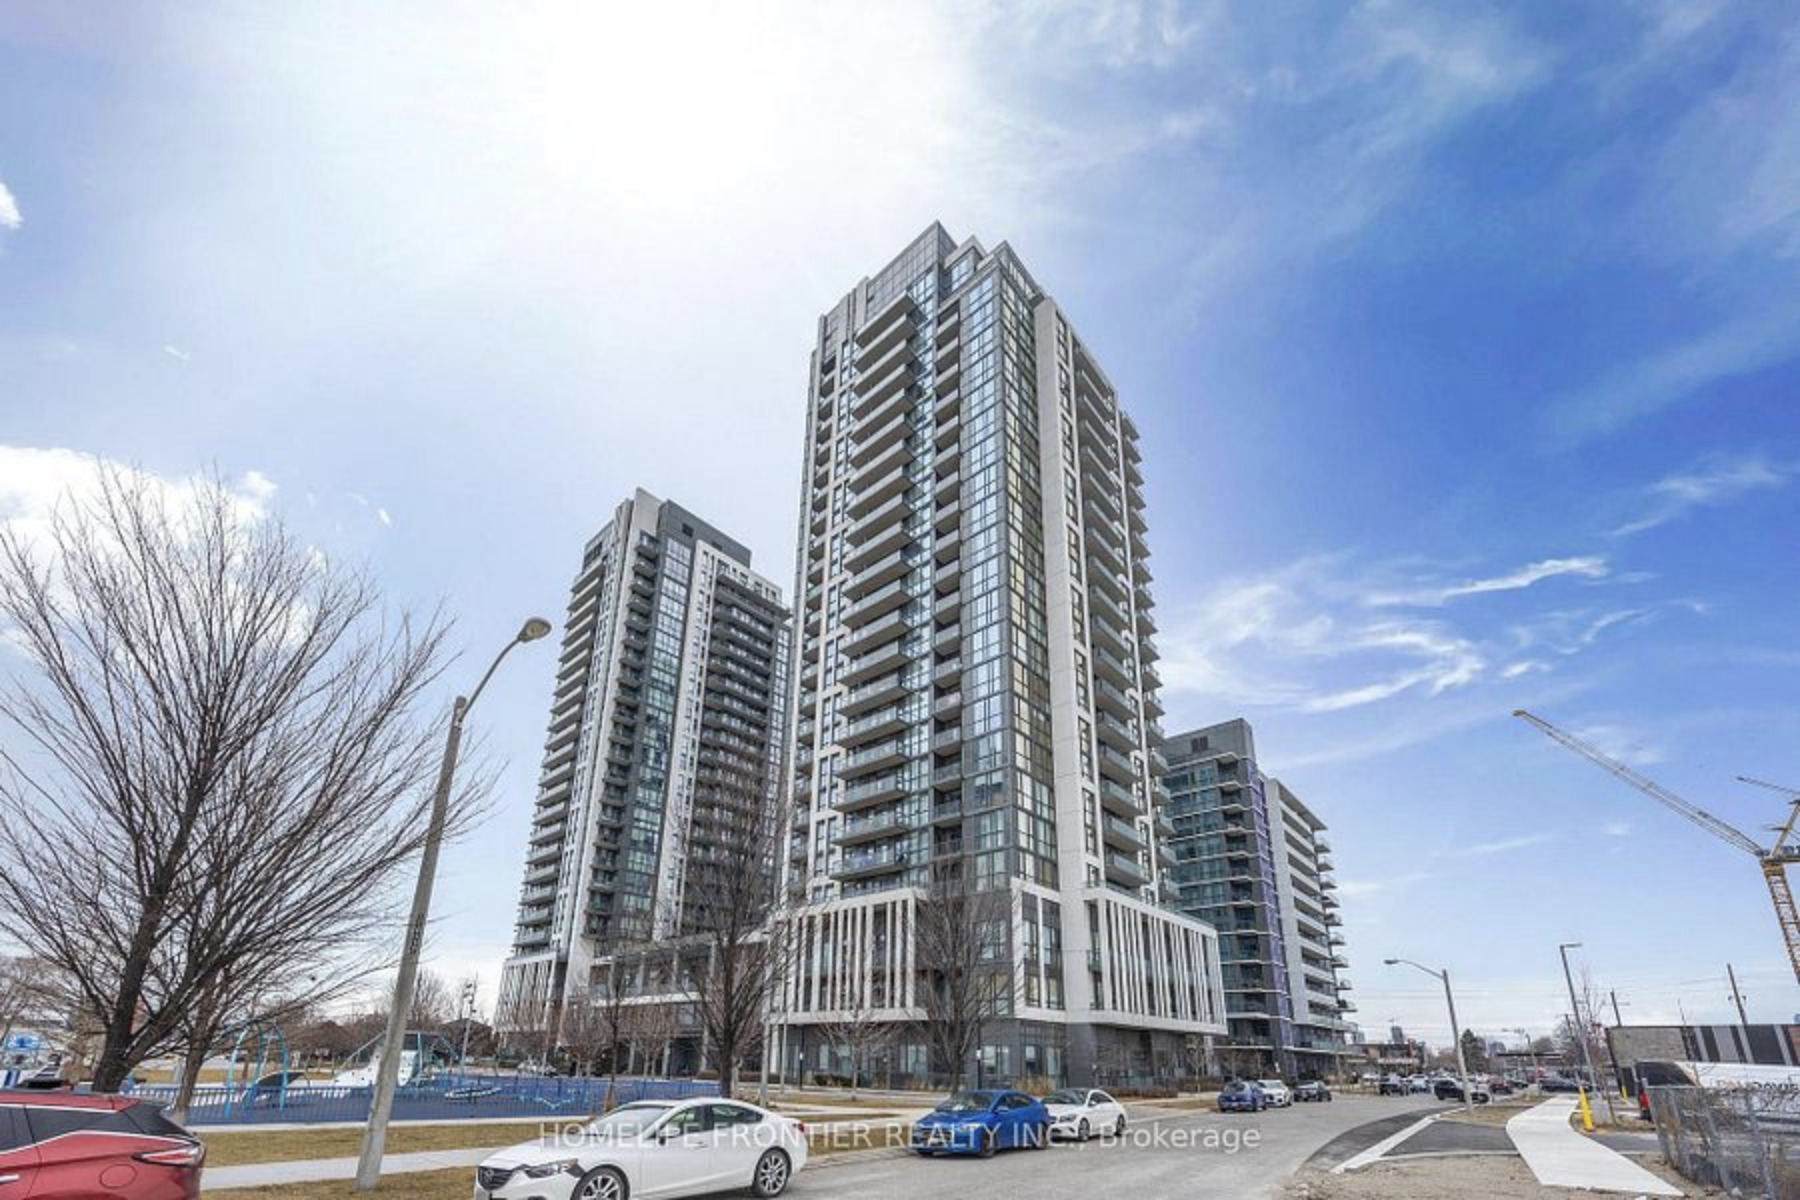
Condo towers near Zorra Street in Islington-City Centre West

REALM listing photography · MLS W12710872 · 17 Zorra St · Editorial context only; not evidence of price or marketability.

Like-for-like price

The gap is not just because one community sold more small units.

When the 2026 samples are aligned on primary bedrooms and reported suite-size bands, Islington–City Centre West remains about 14% lower. Restricting the emphasized shared cells to at least 10 sales in each community produces almost the same result: about 13.9% lower.

Price direction stable under stricter cell thresholds

2026 shared product cells

The common one- and two-bedroom bands show the same broad price direction.

These rows are not a valuation grid. They are the larger shared cells—at least 10 sales in both communities—used to test whether the community gap survives basic product matching.

Bedroom / reported sizeSales M / IMimico medianIslington medianIslington gapMedian DOM M / I
1BR · 500–59950 / 50$465,000$413,500-11.1%32.5 / 28
1BR · 600–69968 / 47$532,500$470,000-11.7%35 / 28
1BR · 700–79917 / 20$545,000$487,500-10.6%24 / 21
2BR · 700–79932 / 24$620,000$555,000-10.5%32.5 / 27.5
2BR · 800–89945 / 46$680,000$584,500-14.0%26 / 27.5
2BR · 900–99927 / 17$730,000$622,000-14.8%28 / 30

M = Mimico; I = Islington–City Centre West. Reported size is the MLS band, not an invented exact square footage. Larger 1000+ sq ft cells exist but can be more building-specific, so they are not used as headline proof.

Marketability

Islington screened slightly faster—but the uncertainty is wide.

Raw 2026 median DOM was 27 days in Islington–City Centre West versus 28.5 in Mimico. After primary-bedroom/size matching, the weighted screen was about 27.1 versus 30.4 days and 56.9% versus 53.3% selling within 30 days.

Raw 202627 vs 28.5

Islington vs Mimico median DOM. The difference is small compared with the price gap.

Matched screen56.9% vs 53.3%

Share sold within 30 days after weighting shared primary-bedroom/size cells.

Do not turn this into “Islington is more liquid.”

The primary-match bootstrap 95% interval for the DOM gap ran from roughly 8 days faster to 4 days slower, and the 30-day sell-through interval also crossed zero. The evidence supports a robust price difference, not a robust marketability winner.

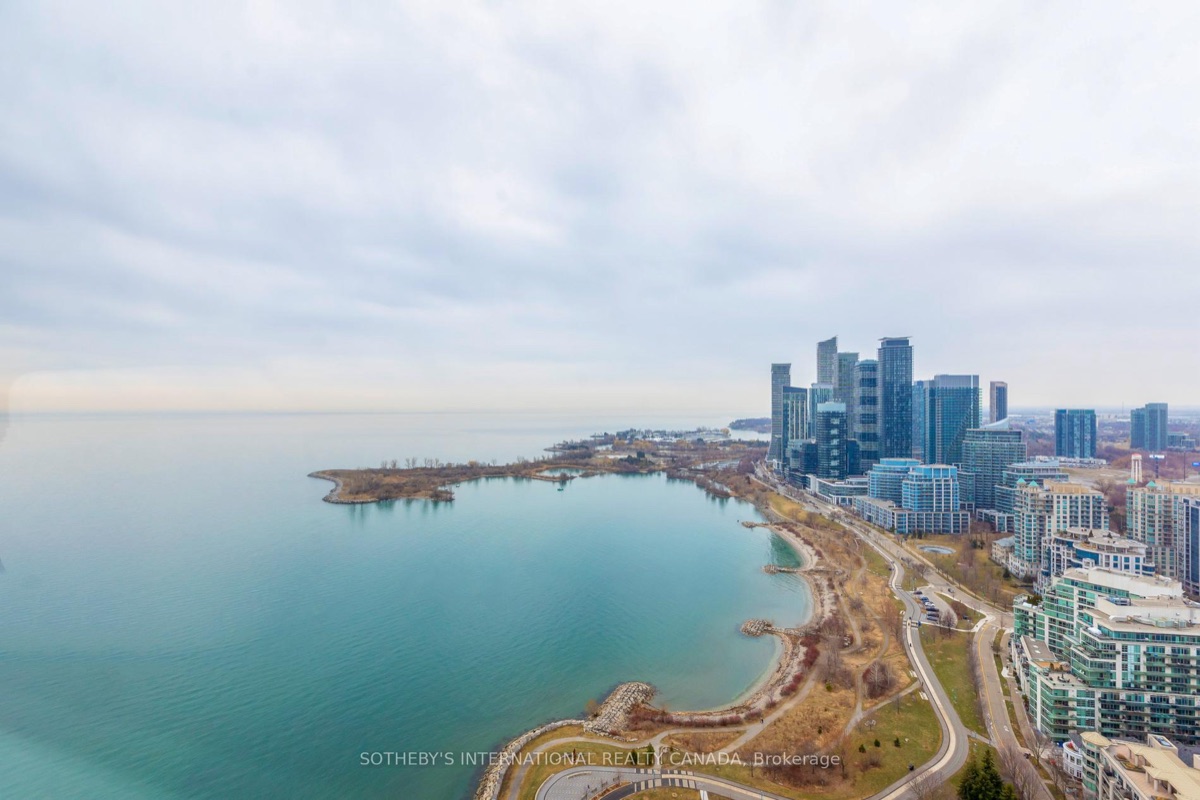
Mimico and Humber Bay Shores waterfront condo skyline

REALM listing photography used in prior MohDian.ca Mimico research · Context only; not evidence of performance.

Geography matters

REALM/TRREB community labels are not the same thing as the City’s current neighbourhood map.

This transaction analysis uses the REALM/TRREB labels Mimico and Islington–City Centre West. Toronto’s current 158-neighbourhood social-planning geography instead separates Islington, Etobicoke City Centre, Mimico-Queensway and Humber Bay Shores. Use the transaction labels for this dataset; use the City geography for current civic/demographic context.

A neighbourhood name is a search boundary, not a substitute for building-level comparables. The next step for a real unit is the exact building, layout, floor, exposure, view, parking, locker, condition and carrying costs.

2025 → 2026 context

Both communities softened after mix control.

Mimico’s raw median made its year-over-year change look much milder than the matched result. Islington–City Centre West was softer on both raw and matched measures.

CommunityRaw median changeBedroom + size matchedExact bed/den + sizeMedian DOM
Mimico-2.5%about -7.1%about -6.3%27 → 28.5 days
Islington–City Centre West-7.6%about -9.4%about -9.5%26 → 27 days

These are matched-period historical comparisons, not forecasts for the rest of 2026 or for an individual condo.

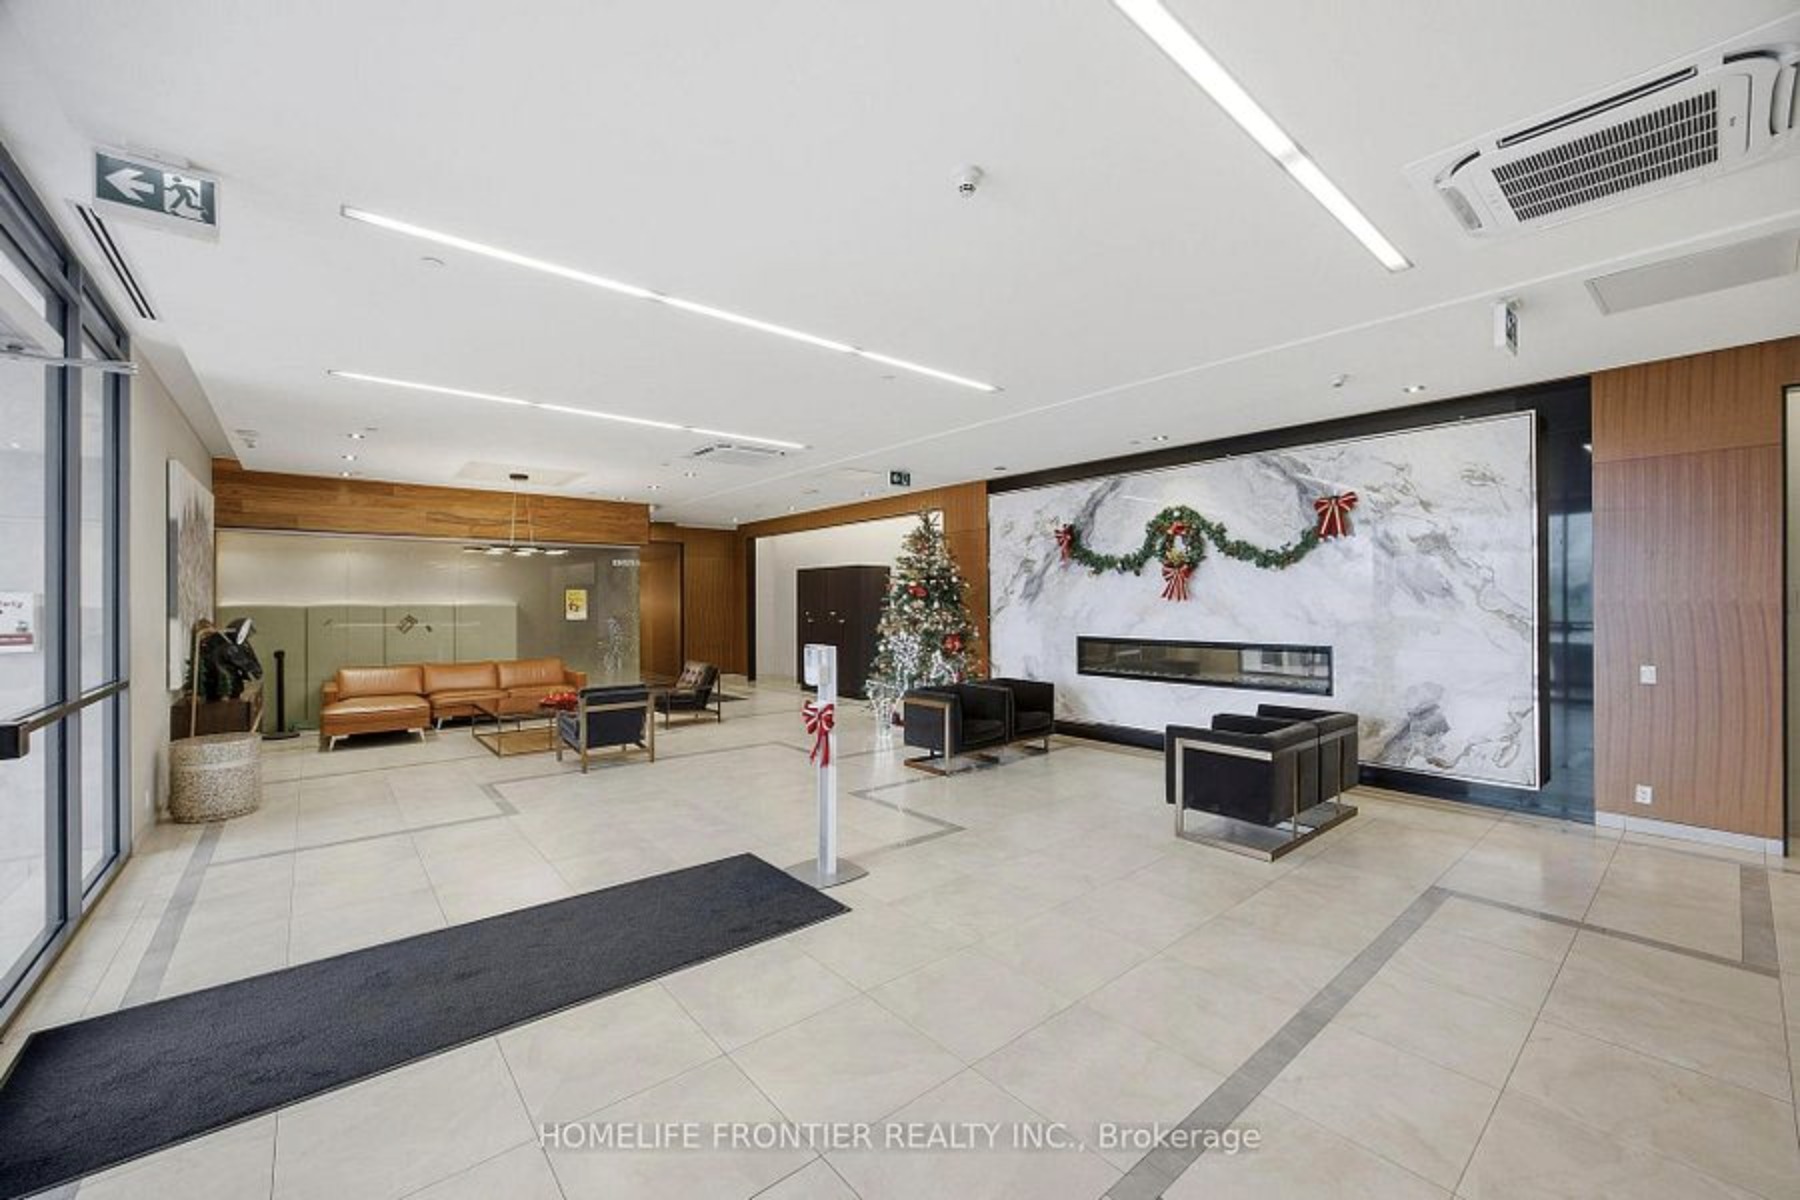
Lobby context from a Zorra Street condo in Islington-City Centre West

REALM listing photography · MLS W12710872 · Lobby context only.

Transit context

The Islington / Etobicoke City Centre side has strong Line 2 access—but verify the exact address.

Kipling Station is the Line 2 terminus with connections to MiWay and Kipling GO. Islington Station also serves Line 2; current Easier Access work affects some entrances and bus operations through the end of 2026. Those are location facts, not explanations for the observed sale-price gap.

Method & uncertainty

How the comparison was built.

1. Acquisition: REALM/TRREB community filters, Sale, Unavailable, Sold, Condo Apartment, Jan. 1–Sep. 20 in each year.

2. Reconciliation: Mimico reconciles to 354 / 340 unique MLS IDs. Islington–City Centre West reconciles to 309 / 282. A REALM pagination anomaly in the 2025 Islington cohort was resolved with overlapping price partitions that deduplicated exactly to the canonical 309.

3. Public filter: Apartment / 1 Storey-Apt only, leaving 329 / 316 Mimico and 296 / 270 Islington records.

4. Primary price match: compare shared primary-bedroom × reported-size cells; weight each cell by the smaller community count.

5. Sensitivity: repeat with exact bedroom + den composition × reported-size cells and with stricter minimum cell sizes.

6. Uncertainty: 4,000 stratified bootstrap replicates. The price-gap interval remained entirely below zero; liquidity intervals crossed zero.

Evidence & limitations

Use the community screen, then move to the building.

FAQ

Mimico vs Islington–City Centre West condo questions.

Which was cheaper in this 2026 condo sample?

Islington-City Centre West. Its raw median was $510,000 versus $609,500 in Mimico. After matching primary bedroom count and reported suite-size bands, the gap was about 14%.

Does the 14% matched gap mean every Islington condo should sell for 14% less?

No. It is a community-level screening result. Building, exact layout, floor, view, exposure, parking, locker, condition, fees and recent same-building solds still determine the relevant unit-level comparison.

Which community sold faster?

The raw 2026 median was 27 days in Islington-City Centre West and 28.5 days in Mimico. The matched screen also leaned slightly faster in Islington, but bootstrap uncertainty crossed zero, so the data does not support treating this as a clear liquidity winner.

Are Islington-City Centre West and Etobicoke City Centre the same boundary?

Not exactly. This analysis uses the REALM/TRREB community label Islington-City Centre West. The City of Toronto now uses a 158-neighbourhood social-planning geography that separates Islington and Etobicoke City Centre.

Is this a forecast for future condo prices?

No. These are historical sold records for matched Jan. 1–Sep. 20 periods in 2025 and 2026. Current buying decisions should be checked against fresh same-building and same-layout comparables.

Are Islington condos always 14% to 16% cheaper than Mimico condos?

No. The historical 2026 completed-sale median for Islington–City Centre West was $510,000 versus $609,500 in Mimico, with a matched bedroom-and-reported-size gap around 14.2%. Individual buildings, views, ages, fees, layouts and proximity to services differ. Compare suitable current same-product condo alternatives and do not assume a resale-speed advantage.

From community to unit

Comparing a Mimico condo with an Islington-area condo?

Send me the two listings. I can narrow the analysis to recent same-building and same-layout solds, then compare floor, exposure, view, parking, locker, condition, fees and carrying costs.

Provide at least one way to reach you.