Humber Bay Shores & Mimico
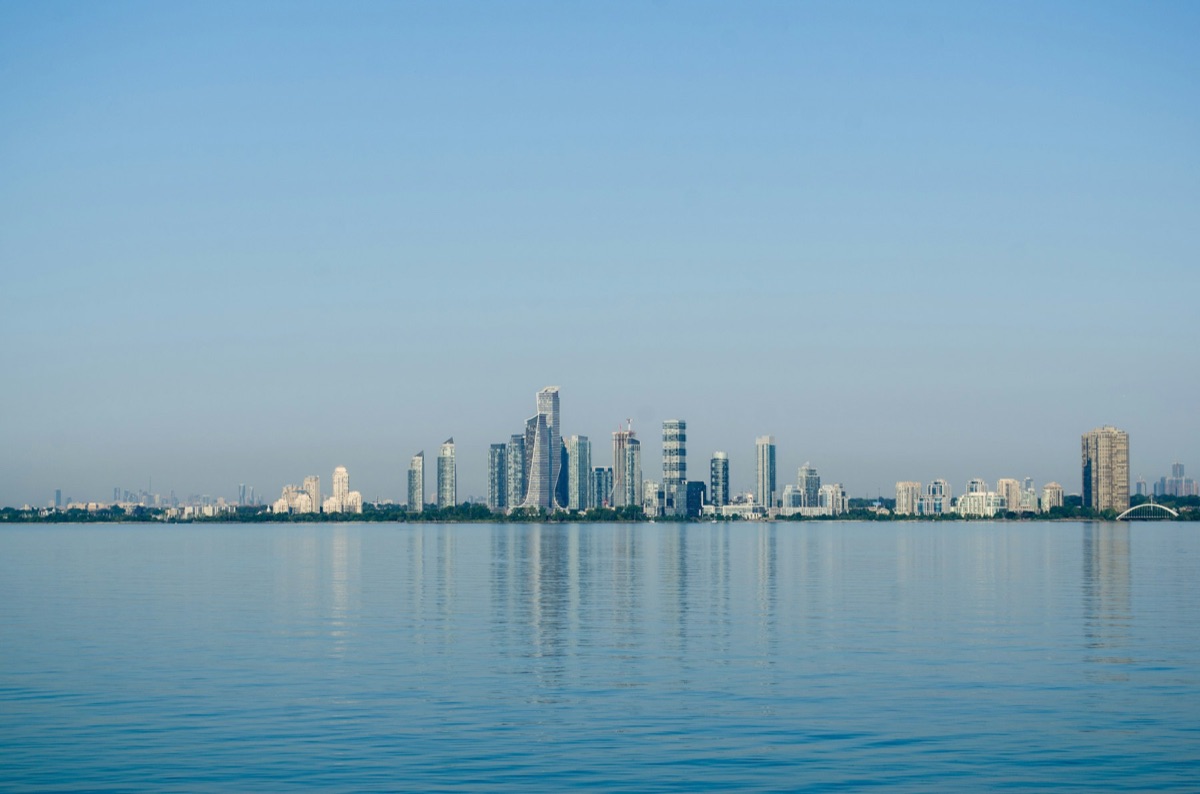
Condo-focused waterfront living with trails, skyline views and access toward Mimico GO. Building age, fees, parking and exact walkability vary materially.
West Toronto real estate
Useful for buyers who want Toronto access while comparing waterfront condos, GO-connected communities, established freehold streets and more suburban housing formats.
Plan a Etobicoke move ↗How to think about Etobicoke
Etobicoke is not one uniform west-end market. South Etobicoke can offer lake access and GO service; central pockets combine subway access with established residential streets; northern areas often shift toward larger roads, car travel and different housing/value trade-offs.
A strong search compares the transportation pattern first, then housing type. A Humber Bay condo and a detached home near The Kingsway may be geographically close but represent completely different budgets, maintenance responsibilities and lifestyles.
Submarkets worth comparing
Condo-focused waterfront living with trails, skyline views and access toward Mimico GO. Building age, fees, parking and exact walkability vary materially.
Lake-adjacent neighbourhoods with a mix of older homes, townhomes and newer development, plus TTC and GO options depending on the address.
Subway-accessible high-rise growth around established residential areas. Buyers often compare condo convenience with nearby freehold pockets.
Established residential streets, larger homes in many pockets and access to Bloor subway stations, generally with a different price profile from south-Etobicoke condos.
A mix of detached homes, townhouses and apartment/condo options. Highway access may be strong while rapid-transit convenience can vary by pocket.
Local market intelligence
These research-backed guides use more specific transaction, building or search evidence for decisions that need a narrower comparison set.
A permanent address-by-address hub connecting current building and complex research across Park Lawn, Annie Craig, Shore Breeze, Marine Parade, Brookers Lane and Palace Pier.
Read the analysis →Complex intelligenceA REALM-backed three-tower analysis using 40 verified broker full sheets, with tower-mix controls, matched-product uncertainty, exact-area and maintenance checks.
Read the analysis →South Etobicoke building intelligenceA REALM-backed 0-vs-3 matched-period guide showing why three verified 2026 sales are useful descriptively without creating a fictional 2025 price baseline.
Read the analysis →Townhouse intelligenceA REALM-backed thin-turnover guide showing zero qualifying matched-period sales in both years, with three verified nearest post-window townhouse transactions and strict same-corporation comp controls.
Read the analysis →Building intelligenceA REALM-backed 4-vs-2 matched-period guide showing why a +20.8% raw median is bedroom-mix sensitive, while the only repeated 2BR / 900-999 product is +3.6% and DOM is slower.
Read the analysis →Hard-loft intelligenceA REALM-backed 19-sale guide separating MTCC 1260 and MTCC 1216, with stronger repeated 250 Manitoba 1BR pricing, faster liquidity and zero matched-period 2026 sales at 300 Manitoba.
Read the analysis →Building intelligenceA REALM-backed 9-vs-7 matched-period guide using 16 verified broker full sheets, with about -9.4% bedroom/size matched pricing, slower DOM, exact-area and maintenance context.
Read the analysis →Thin-turnover loft intelligenceA REALM-backed 2-vs-0 guide using verified exact-area loft sales to explain how to value a low-turnover Mystic Pointe building without inventing a year-over-year trend.
Read the analysis →Building intelligenceA REALM-backed 6-vs-2 matched-period analysis showing why an almost-flat raw median conflicts with about -25.7% repeated 2BR pricing while exact-area evidence is thinner.
Read the analysis →Building intelligenceA REALM-backed 5-vs-12 matched-period analysis using 17 sold records, separating single-level and loft product and reconciling total-price changes with exact-area evidence.
Read the analysis →Building intelligenceA REALM-backed 9-vs-4 matched-period analysis using 13 broker full sheets, showing why a +9.1% raw median reverses to about -9.9% after bedroom/size matching while DOM also lengthens.
Read the analysis →Thin-turnover building intelligenceA REALM-backed 1-vs-0 matched-period guide showing why thin turnover requires a disciplined comp-widening sequence rather than a fabricated year-over-year percentage.
Read the analysis →Building intelligenceA REALM-backed 10-vs-6 primary single-level analysis using 18 verified sold broker sheets, showing why a +12.6% raw median conflicts with near-flat repeated 2BR pricing and materially slower DOM.
Read the analysis →Complex intelligenceA REALM-backed 7-vs-10 matched-period analysis using 17 broker full sheets, with one exact repeated 965 sq. ft. 2BR benchmark, materially slower DOM and maintenance-intensity context.
Read the analysis →Complex intelligenceA REALM-backed 6-vs-3 primary high-rise analysis using 9 verified broker full sheets, showing why a -44% raw median collapses to a much steadier exact-area matched signal.
Read the analysis →Complex intelligenceA REALM-backed 8-vs-9 matched-period analysis using 17 verified broker full sheets, with separate MTCC 864 / 912 / 973 controls, near-flat matched pricing and faster liquidity.
Read the analysis →Building intelligenceA REALM-backed 4-vs-6 matched-period analysis using 10 verified broker full sheets, with near-flat repeated 2BR pricing, exact-area, DOM and maintenance checks.
Read the analysis →Complex intelligenceA REALM-backed 6-vs-8 matched-period complex analysis using 14 verified broker full sheets, with separate TSCC 1643 / 1654 controls and Voyager I matched-product benchmarks.
Read the analysis →Building intelligenceA REALM-backed 1-vs-2 matched-period analysis using all 3 verified broker full sheets, with one repeated 2BR comparison and explicit limits on the raw building median.
Read the analysis →Building intelligenceA REALM-backed 5-vs-3 matched-period analysis using 8 verified broker full sheets, with thin-sample matched pricing, slower DOM, exact-area and maintenance checks.
Read the analysis →Building intelligenceA REALM-backed 7-vs-11 matched-period analysis using 18 verified broker full sheets, with raw-vs-matched pricing, faster DOM, exact-area and maintenance checks.
Read the analysis →Building intelligenceA REALM-backed 8-vs-11 matched-period analysis using 19 verified broker full sheets, with matched-product uncertainty, slower DOM, exact-area and maintenance checks.
Read the analysis →Building intelligenceA REALM-backed 10-vs-8 matched-period analysis using 18 verified broker full sheets, with matched-product uncertainty, exact-area $/ft², DOM and maintenance checks.
Read the analysis →Building intelligenceA REALM-backed 12-vs-14 matched-period analysis using 26 verified broker full sheets, with matched-product pricing, exact-area $/ft², DOM and maintenance checks.
Read the analysis →Building intelligenceA REALM-backed 6-vs-8 matched-period analysis using 14 verified broker full sheets, with slower DOM and explicit uncertainty around matched-product and exact-area signals.
Read the analysis →Building intelligenceA REALM-backed 12-vs-9 matched-period analysis using 21 verified broker full sheets, showing why the raw median diverges sharply from matched-product and exact-area checks.
Read the analysis →Building intelligenceA REALM-backed 10-vs-8 matched-period analysis using 18 verified broker full sheets, with mix-adjusted pricing, exact-area, DOM and maintenance checks.
Read the analysis →Building intelligenceA REALM-backed 13-vs-15 matched-period analysis using 28 verified broker full sheets, with matched-product, exact-area, DOM and maintenance checks.
Read the analysis →Building intelligenceA REALM-backed 14-vs-6 matched-period analysis across both Ocean Club addresses, with exact-area, maintenance and repeated-product checks.
Read the analysis →Building intelligenceA REALM-backed 17-vs-12 matched-period analysis showing why the raw median needs comparable-product, exact-area and maintenance context.
Read the analysis →Building intelligenceA REALM-backed guide using matched 11-sale 2025/2026 apartment cohorts, exact-area pricing and maintenance-fee context.
Read the analysis →Building intelligenceA REALM-backed complex guide using 38 distinct 2025 and 18 distinct 2026 transactions, plus full-sheet exact-area and maintenance-fee context.
Read the analysis →Building intelligenceA REALM-backed twin-tower guide using 37 matched-period sales and all 21 2026 sold full sheets for exact-size and maintenance-fee context.
Read the analysis →Etobicoke condo comparisonA reconciled Jan–Sep REALM analysis showing a robust 2026 price difference but a much less decisive marketability gap.
Read the analysis →Condo liquidity analysisA 645-sale matched Jan–Sep REALM analysis of median DOM, 30-day sell-through and bedroom/size mix.
Read the analysis →Building-level resale analysisA 645-sale final cohort comparing matched Jan–Sep 2025 and 2026 results, with repeat-building checks and bedroom/size normalization.
Read the analysis →Neighbourhood intelligenceBuilding clusters, transit reality, buyer shortcuts to avoid and the evidence that matters before narrowing to a unit.
Read the analysis →Search methodologyWhy MLS naming can blur the waterfront search—and how to avoid missing relevant listings or comparing the wrong micro-market.
Read the analysis →Unit-level due diligenceA practical framework for floor, exposure, sightline evidence and planning context before paying for a view premium.
Read the analysis →Carrying-cost analysisA 107-sale panel showing why fee-per-square-foot is a useful screening metric—but not a building-quality score.
Read the analysis →Building-level market intelligenceA REALM-backed building comparison using current sales, leases, price-per-square-foot, DOM and maintenance-fee context.
Read the analysis →Trade-offs
Buyer questions
Seller considerations
Official resources
Transit schedules, planning policy and development activity can change over time. These official sources are useful starting points for address-specific research.
Common questions
They overlap in how people discuss south Etobicoke, but the built form and feel can differ. High-rise waterfront clusters, older Mimico streets and areas closer to GO each create distinct trade-offs.
Yes in many pockets, but the answer depends on the exact address and travel mode. GO, subway and streetcar access should be compared against first/last-mile time.
There is a wide range. Some waterfront towers are relatively recent, while other buildings and apartment-style condos are older. Building-level review matters more than a neighbourhood generalization.
Plan a Etobicoke move
Your request will carry Etobicoke as the area context, so the first conversation starts with the right geography.
See the buying process →