MDMoh DianMohammad Hassan Mohammadian · Realtor®
Menu
Plan your move↗
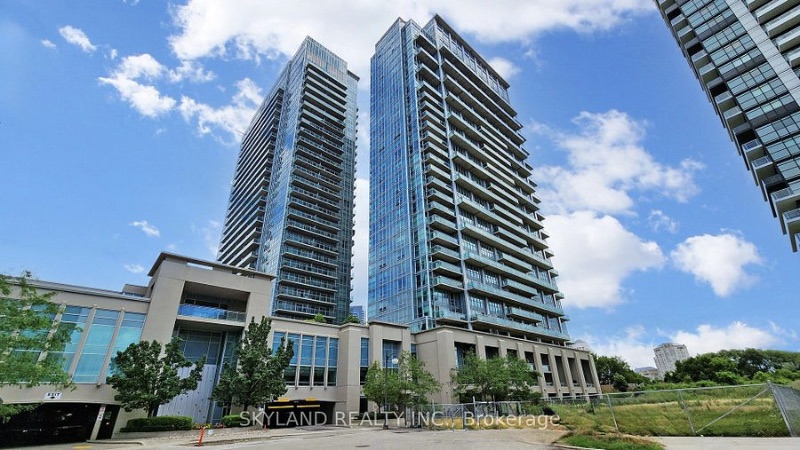
California Condos tower at 165 Legion Road North in Etobicoke

Mimico building intelligence · September 2026

California Condos’ median rose—but the matched product moved the other way.

The raw 2026 median is higher at 165 Legion Road North. Once bedroom count and reported size are matched, the direction reverses and market time also lengthens.

9 sales in 20254 in 2026TSCC 2289

A higher median is not the same as a higher unit value

California Condos' median rose. Why might a buyer or seller reach the opposite conclusion?

Imagine a seller at 165 Legion seeing a headline that the 2026 median was 9.1% higher and preparing to raise the asking price. A buyer of a compact one-bedroom notices that the actual comparable-size sales tell a different story. Both could make poor decisions from a four-sale annual snapshot. The original REALM sample separates unlike layouts and finds a roughly 9.9% lower matched-product screen. These are hypothetical decision examples, not specific offers or valuations.

For a buyer

Match your actual bedroom and size group.

The repeated one-bedroom, 500–599 ft² group screened roughly 22.5% lower, while the 600–699 ft² one-bedroom group screened about 8.2% higher. Those cells are small and move differently, so neither should be applied automatically to your actual condo.

Next check: Compare same-sized suites in TSCC 2289 with the correct den, floor, view and parking/locker rights. Check current corporation documents and monthly ownership costs before using any past sale as a negotiating anchor.

Read the condo-corporation due-diligence checklist →
For a seller

Do not assume that the 9.1% headline is an asking-price increase.

The raw median moved from $526,000 to $574,000, but it mixed sizes. The 2026 set included only four completed sales, and the observed median selling time moved from 40 days to 72 days.

Next check: Review current same-layout competition, condition, floor and exposure, and determine a list-price strategy that matches the product rather than relying on a broad 2026 median.

Decide what to prepare before pricing →

Four details that matter more than a headline percentage

  1. Is this a one-bedroom or two-bedroom, what is its reported and usable size, and is it truly comparable to the sold examples?
  2. What did the relevant sale group do, and how thin was its sample compared with the building-wide mixed median?
  3. What do current TSCC 2289 documents, common expenses, property tax and parking or locker rights mean for this exact unit?

Nine historical 2025 sales and four 2026 sales were used in the locked September 20 cohorts, with different product mixes and a limited matched-cell calculation. The original full-sheet data, anomalies and limitations remain unchanged. This does not provide a present-day appraisal, unit-specific appreciation rate, or rent forecast.

Matched-period snapshot

Raw +9.1%. Matched product about −9.9%.

The direction changes after controlling for the physical product, which is exactly why a building-level median cannot stand alone.

9 → 4Matched-period sales
$526K → $574KRaw median · about +9.1%
~−9.9%Bedroom + size-band matched estimate
40 → 72 daysMedian DOM
6/9 → 4/4Usable exact-area coverage
13 / 13Sold broker sheets reopened

The matched estimate uses four repeated bedroom × reported-size cells and covers every 2026 sale, but only 44.4% of the 2025 cohort. It is more comparable than the raw median, not a perfect building appreciation index.

The contradiction

2026 sells fewer units, at a higher raw median, but with softer like-for-like pricing.

Raw median +9.1%

$526K → $574K across unlike product mixes.

Matched estimate −9.9%

All four 2026 sales map to a repeated 2025 bedroom + size cell.

DOM 40 → 72

The completed 2026 sample took longer to sell.

2 of 4 over 60 DOM

Half the 2026 sales exceeded 60 days on market.

Repeated-product cells

The four matched cells do not move together.

That split is the strongest reason to avoid describing the building with one headline percentage.

1BR · 500–599$526K → $407.5K
Change
~−22.5%
2025 sales
1
2026 sales
1
Exact-area repeat
Unavailable
1BR · 600–699$525K → $568K
Change
~+8.2%
2025 sales
3
2026 sales
1
Exact $/ft²
Also ~+8.2%
2BR · 800–899$675K → $580K
Change
~−14.1%
Exact area
845 → 856 ft²
Exact $/ft²
~−15.2%
2026 DOM
373 days
2BR · 900–999$840K → $770K
Change
~−8.3%
2025 sales
1
2026 sales
1
2025 exact area
Unavailable
Weighted matched price~−9.9%
Repeated cells
4
Matched weight
4
2025 coverage
44.4%
2026 coverage
100%
Matched exact-area sensitivity~−4.2%
Usable repeated cells
2
Use
Secondary sensitivity
Limitation
Thin exact-area coverage
Conclusion
Do not over-precision

Liquidity

Market time also weakened in the completed-sale sample.

The 2026 cohort is small, but the median and tail both move toward longer marketing periods.

40 → 72 daysMedian DOM
3/9 → 1/4Sold within 30 days
2/9 → 2/4Sales over 60 days
373 daysLongest 2026 sale

Exact area & carrying costs

The broad $/ft² direction is softer, with better 2026 coverage.

Three 2025 sheets leave exact finished area blank. No missing value is imputed.

6/9 → 4/4Exact-area coverage
~$839 → ~$746/ft²Broad raw exact-area median
~$1.08 → ~$1.19Observed maintenance / exact ft² / month
~+10.2%Observed maintenance-intensity median change

The broad exact-area median is descriptive because product mix and data coverage change. The two-cell matched exact-area sensitivity is the cleaner cross-check, but it is too thin for over-precision.

Building identity

California Condos is a separate corporation from neighbouring iLofts.

Public building references identify California Condos at 165 Legion Rd N as a Camrost Felcorp tower registered in 2013, with 30 storeys, 372 units and corporation TSCC 2289. The adjacent iLofts at 155 Legion is a different corporation and should not be merged into the same resale pool.

165Legion Rd N
TSCC 2289Corporation
30 storeysPublic building reference
372 unitsPublic building reference

Verified visual context

Compact suites, larger two-bedrooms and resort-style common amenities.

These preserved REALM images come from verified matched-period California sales and are used as building/product context only.

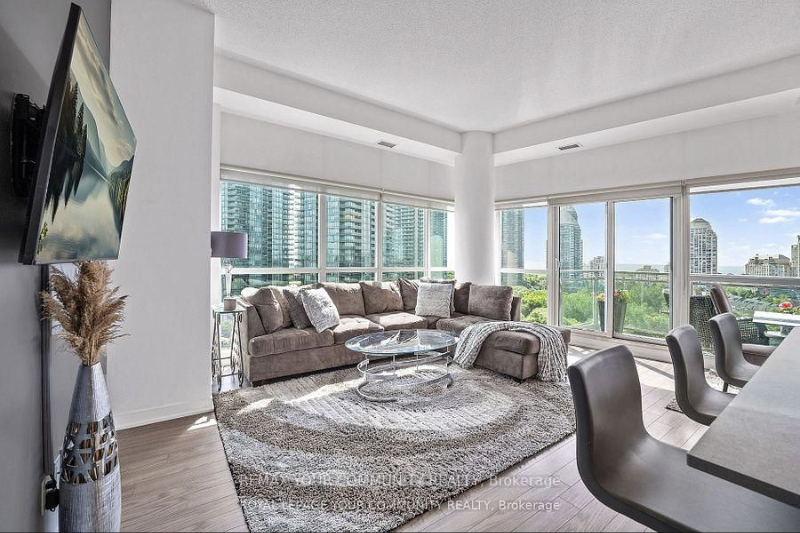
Representative California Condos interior at 165 Legion Road North
Representative verified California interior
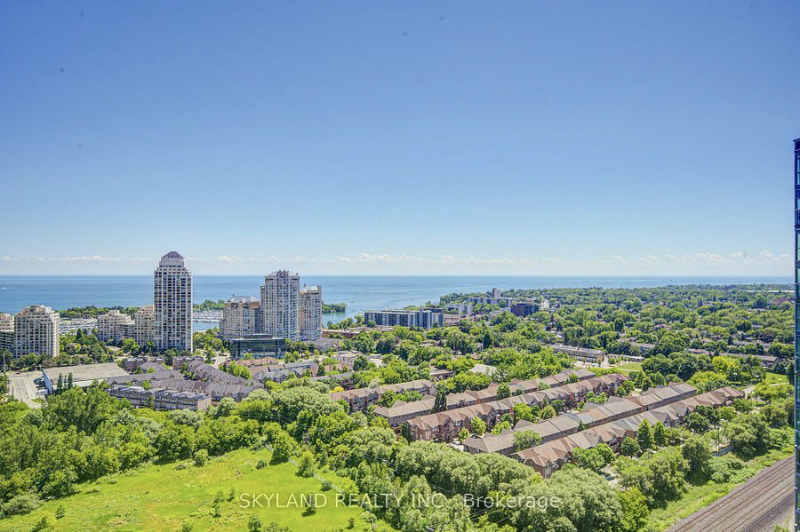
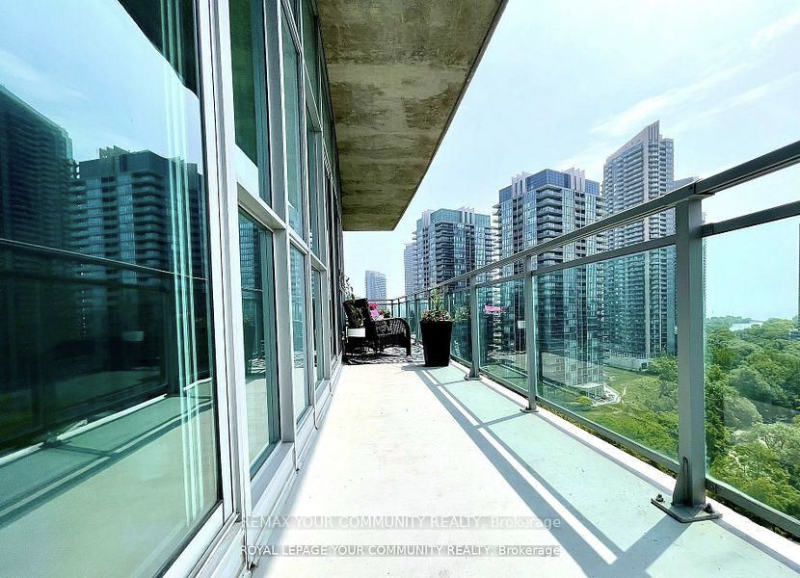
Balcony and neighbourhood view from California Condos
Balcony / view context
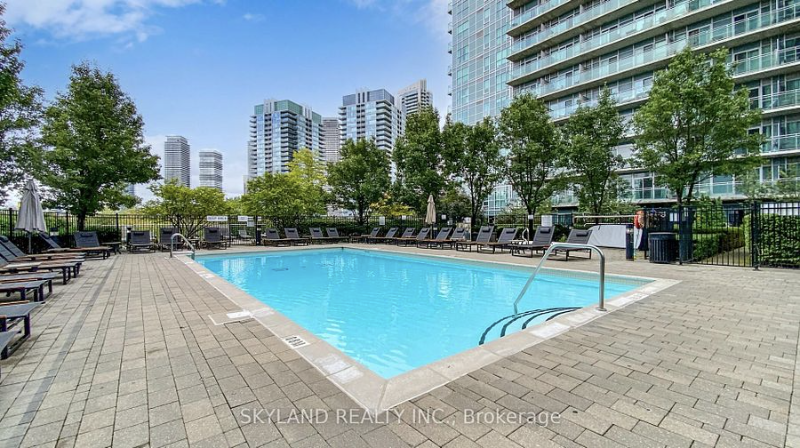
Outdoor pool amenity at California Condos
Pool / amenity context

Preserved REALM listing photography from verified matched-period sales; original brokerage watermarks retained.

View toward Humber Bay and Mimico from California Condos

Park Lawn / Legion context

Very close to the waterfront cluster, but a different resale pool.

Public references list concierge, gym, pool, rooftop / outdoor spaces and related resident amenities. California’s smaller-suite mix and separate corporation mean its resale evidence should not be blended casually with Westlake, Beyond the Sea or neighbouring iLofts.

Unit-level due diligence

How I would compare a California Condos unit.

1. Keep 165 Legion separate from 155 Legion. Same developer and adjacent location do not make the corporations interchangeable.

2. Match bedroom count and reported size first. The 2025/2026 cells move in different directions.

3. Use exact finished area where available. Broad size bands can still contain meaningful area differences.

4. Compare exposure, floor, parking, locker and condition. These matter especially in compact one-bedroom product.

5. Review current corporation documents and fees. Historical maintenance intensity is only a screening input.

Methodology

How the California Condos analysis was built.

1. Scope. Matching Jan. 1-Sep. 20 periods in 2025 and 2026 at exactly 165 Legion Rd N.

2. Broad style screen. All residential condo styles were allowed first so townhouse-style, loft or T-unit product could be separated if present. All 13 matched-window sales were standard apartment-style Condo Apt records.

3. Full-sheet verification. All 13 broker sheets were reopened. Two initial page-load failures were resolved with targeted retries.

4. Matched product. Bedroom count × reported size band creates four repeated cells and covers all four 2026 sales.

5. Exact-area reconciliation. Exact area is usable for 6 of 9 2025 sales and all 4 2026 sales. Missing fields remain blank.

6. Corporation control. TSCC 2289 is consistently supported except for one isolated 2025 sheet showing TSCC 2822 and one TSCP prefix typo; these are documented as data-quality exceptions rather than silently normalized.

7. Interpretation. The raw median rises because product mix shifts. Like-for-like pricing and liquidity give the more cautious reading.

Sources & verification

REALM transaction evidence first; public sources for building identity and amenities.

FAQ

Questions buyers and owners ask about California Condos.

Did California Condos prices rise 9% in 2026?

The raw Jan. 1-Sep. 20 median moved from $526,000 to $574,000, about 9.1% higher. But the 2026 sample contains a different mix of suite sizes. After matching bedroom count and reported size band, the weighted result is about 9.9% lower.

What did the repeated product cells show?

The four repeated cells split sharply: 1BR / 500-599 fell about 22.5%, 1BR / 600-699 rose about 8.2%, 2BR / 800-899 fell about 14.1%, and 2BR / 900-999 fell about 8.3%. That is why one building-wide median is not enough.

How did days on market change?

Median DOM moved from 40 days in 2025 to 72 days in 2026. Three of nine 2025 sales completed within 30 days versus one of four in 2026; two of four 2026 sales took more than 60 days.

How complete is the exact-area evidence?

Exact finished area is usable for 6 of 9 2025 sales and all 4 2026 sales. The broad exact-area median moved from about $839 to $746 per square foot, but that broad figure remains product-mix sensitive.

What did the matched exact-area comparison show?

Only two repeated bedroom-and-size cells have usable exact finished area in both years. Across those two cells, the matched exact-area estimate is about 4.2% lower. It is a useful sensitivity check, not a precise building-wide rate.

What is TSCC 2289?

TSCC 2289 is the condominium corporation associated with California Condos at 165 Legion Road North. One 2025 broker sheet shows TSCC 2822, which conflicts with the other verified sheets and the public building record and is treated here as an isolated entry error.

Did California Condos really appreciate by 9.1% in 2026?

The historical mixed-unit sale median at 165 Legion rose from $526,000 to $574,000, about 9.1%. But the bedroom-and-reported-size matched-product screen was around 9.9% lower, in a very small sample. Neither figure establishes the change in value of an individual condo; a current unit must be compared with similar suites and actual competition.

Unit-level California analysis

Comparing a condo at 165 Legion Rd N?

Send me the listing or unit number. I can narrow the evidence to the closest California Condos solds by exact area, bedroom count, floor, exposure, parking, locker, condition and current condo documents.

Provide at least one way to reach you.

Prefer to share your full buying criteria? Complete the buyer questionnaire →