MDMoh DianMohammad Hassan Mohammadian · Realtor®
Menu
Plan your move↗
Empire Phoenix Condos at 251 Manitoba Street

Mimico / Mystic Pointe building intelligence · September 2026

Empire Phoenix: the raw median slipped 4.7%. Like-for-like product points materially softer.

I matched the same Jan. 1-Sep. 20 REALM sold window for 2025 and 2026, then re-opened all 16 broker full sheets at 251 Manitoba to verify sold status, area, maintenance, parking and corporation data.

9 sales in 20257 in 2026251 Manitoba St

What the average sale price can hide

If Empire Phoenix's median fell 4.7%, does that tell you what a particular suite is worth?

Imagine a buyer looking at a compact Empire Phoenix one-bedroom and an owner planning to sell a larger two-bedroom. They both hear the 2026 raw building median was 4.7% lower, but they need different benchmarks. The locked bedroom-and-size matched historical estimate was about 9.4% lower, and the small repeated product groups diverged. Neither number is a current quote or a guaranteed discount for the individual suite. These are illustrative buyer and owner decisions.

For a buyer choosing a unit

A matching bedroom and size group matters more than the tower-wide median.

The repeated one-bedroom group in this study moved from a $526,000 median to $467,000, while a two-bedroom group moved from about $681,750 to $578,000. They describe different physical homes in small historical cells.

Next check: Start inside TSCC 2957, compare the actual floor, usable area, den, exposure, parking and locker rights, and verify current corporation fees. Ask for current alternatives rather than applying one percentage to your offer.

Compare true monthly condo costs →
For a seller at 251 Manitoba

Selling speed and your actual competing listings matter.

The historical median selling time moved from 47 to 56 days, but that observation does not predict how long your condo will take. The 2026 completed-sale sample contains only seven units.

Next check: Review the closest recent same-layout sales and live competing listings, including renovation condition, current monthly fees and whether a preparation budget materially improves presentation.

Plan preparation and a realistic price →

Three checks before concluding what the building trend means

  1. Is this exact condo a one-bedroom or two-bedroom, and does its size, den and layout match the historical comparison group?
  2. What are the current unit fees, inclusions, status-certificate details, parking rights and total monthly ownership cost?
  3. Would the buyer compare this unit against a newer or renovated neighbour at a different price or with a better floor plan?

The historical matched January–September 2025 and 2026 cohorts contain nine and seven verified sales. Bedroom-and-size groups can remain small, and the matched estimator is a directional sample screen, not a valuation or forecast. One corporation-number omission in a source sheet remains documented in the original research.

2026 resale snapshot

Seven verified sales, a $510K raw median and slower observed liquidity.

The building-level median alone understates the change inside its repeated one- and two-bedroom product cells.

7Verified 2026 sales
$510KRaw median sold price
56 daysMedian DOM
2 / 7Sold within 30 days
$852Median sold / exact reported ft²
$0.773Median maintenance / exact ft² / month

Matched Jan. 1-Sep. 20 periods: 9 sales in 2025 and 7 in 2026. Sold counts describe completed transactions, not total listing supply or sell-through probability.

What changed?

The controlled price signal is softer than the raw building median.

$535K → $510K

Raw matched-period median: −4.7%.

−9.4%

Bedroom + reported-size matched estimate.

−14.5% to −3.0%

Matched-price bootstrap 95% range.

47 → 56 days

Median DOM moved slower.

The matched estimate stays below zero across the deterministic 10,000-draw bootstrap, but it remains a sample-specific screening result—not proof that every Empire Phoenix suite changed by the same percentage.

Matched-product sensitivity

Six matched-weight observations cover most of the 2026 sale set.

I matched primary bedroom count with the reported MLS size band, then combined common strata using the smaller year count as the weight.

−9.4%Matched bedroom + size estimate
6Total matched weight
67%Matched coverage of 2025
86%Matched coverage of 2026
10,000Deterministic bootstrap draws
100%Bootstrap draws below zero

The result is stronger directionally than many thin-building samples in this series, but the correct use remains unit-level comp screening—not a blanket appraisal percentage.

Repeated-product checks

Two common product cells moved lower; one thin two-bedroom pair moved higher.

That divergence is why I would never apply the building-wide matched estimate mechanically to a particular suite.

1BR / 500-599 sq ft$526K → $467K
Sales
5 → 3
Change
−11.2%
Matched weight
3
2BR / 700-799 sq ft$681.75K → $578K
Sales
2 → 3
Change
−15.2%
Matched weight
2
2BR / 800-899 sq ft$715K → $785K
Sales
1 → 1
Change
+9.8%
Matched weight
1

The 800-899 sq. ft. cell is one sale in each year and should not be generalized. Floor, exposure, exact area, balcony, view, parking, locker and condition remain material unit-level variables.

Exact-area & carrying-cost sensitivity

Exact-area pricing also screens softer, but 2025 coverage is incomplete.

Four of nine 2025 full sheets populate a usable exact finished-area field versus all seven in 2026. That asymmetry limits the broad $/ft² comparison.

$8842025 broad median sold / ft² (n=4)
$8522026 broad median sold / ft² (n=7)
−6.1%Matched exact-area sensitivity
$0.7302025 maintenance / ft² median
$0.7732026 maintenance / ft² median
96.6%2026 median sale/list ratio

Historical listing-reported maintenance is screening context only. Current fees, inclusions, reserve-fund information, insurance, litigation and special assessments belong in the current status-certificate review.

Liquidity

The matched 2026 period took longer to clear.

Price direction and marketability should be read separately. In this sample, the market-time evidence also became less favorable.

47 → 56Median DOM
4 / 9 → 2 / 7Sold within 30 days
3 / 9 → 3 / 7Sales over 60 DOM
96.35% → 96.59%Median sale/list ratio

Sale/list ratios were nearly unchanged even as median market time increased. That combination is more useful than treating either metric alone as a complete negotiation signal.

Building identity

Empire Phoenix is the two-tower Empire Communities development at 251 Manitoba.

Empire Communities describes Phoenix as a two-tower South Etobicoke development designed by Graziani + Corazza. Public completed-building references report 499 units, with the taller tower at 29 storeys and completion around 2022.

251Manitoba Street
499Public-reference units
29 + 11Public-reference tower heights
2957TSCC corporation number

Fresh transaction verification supports TSCC 2957. One 2026 broker sheet reports TSCC / 0, while the other 15 verified matched-period sheets resolve numerically to 2957. The anomaly remains preserved in the evidence package.

Building and unit context

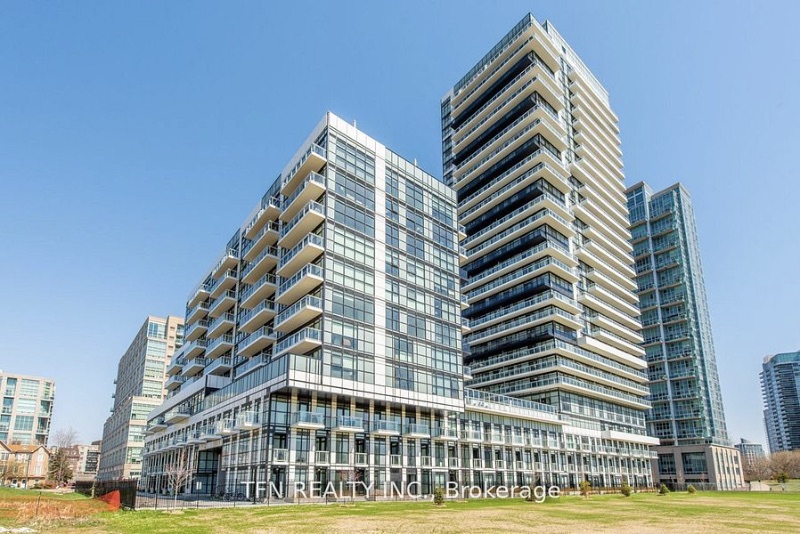
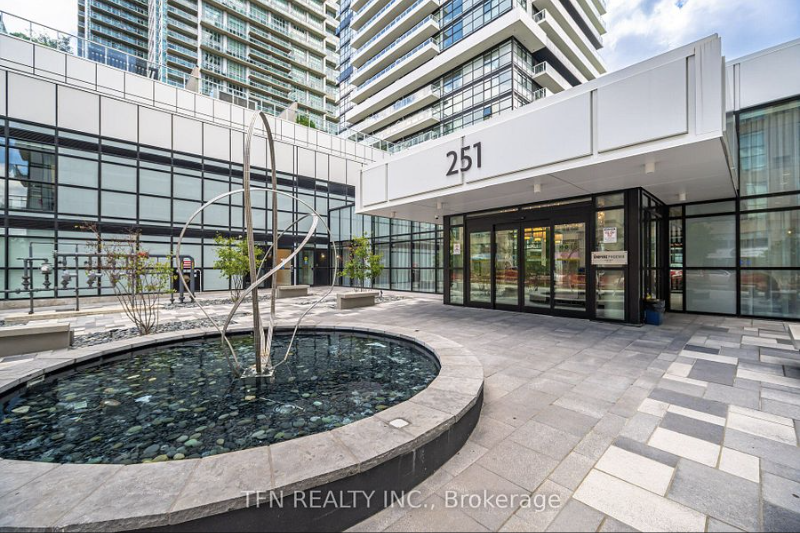
The physical product spans two towers, courtyard amenities and varied suite exposures.

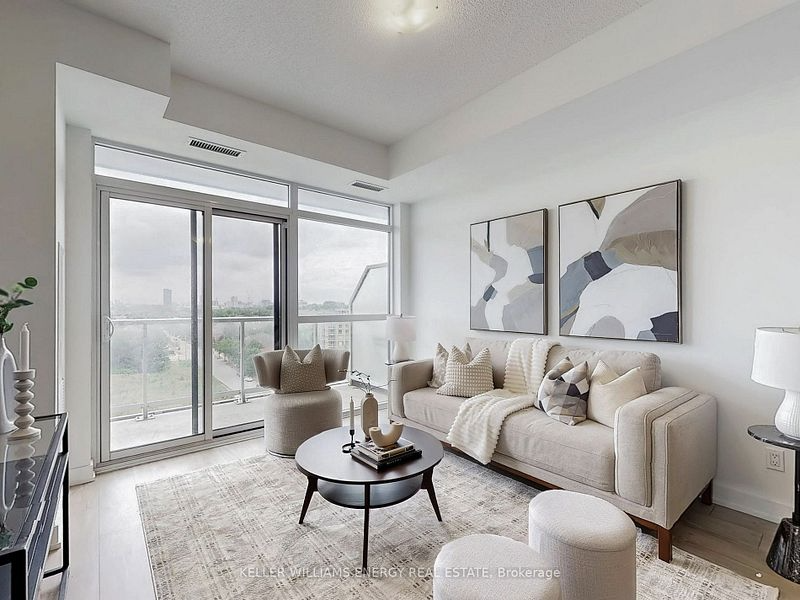
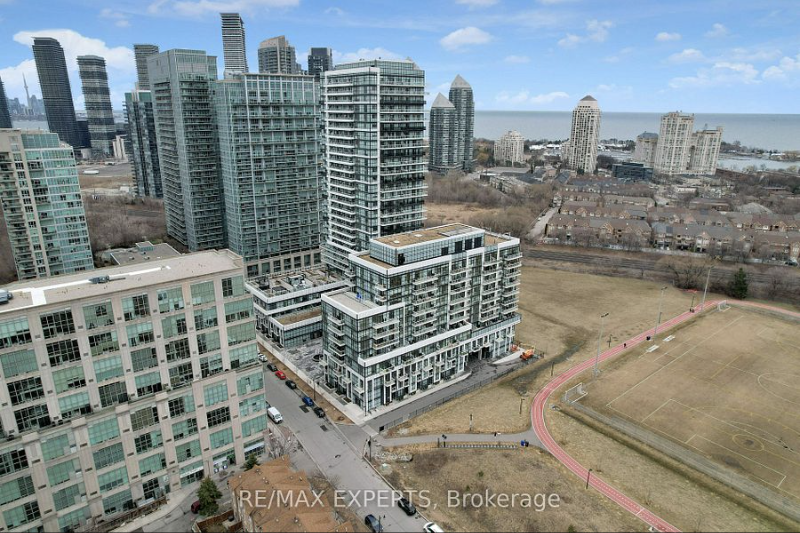
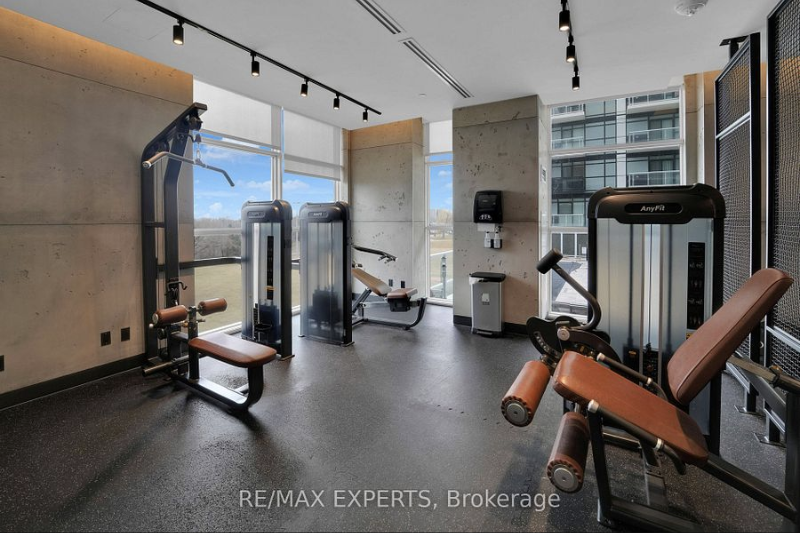
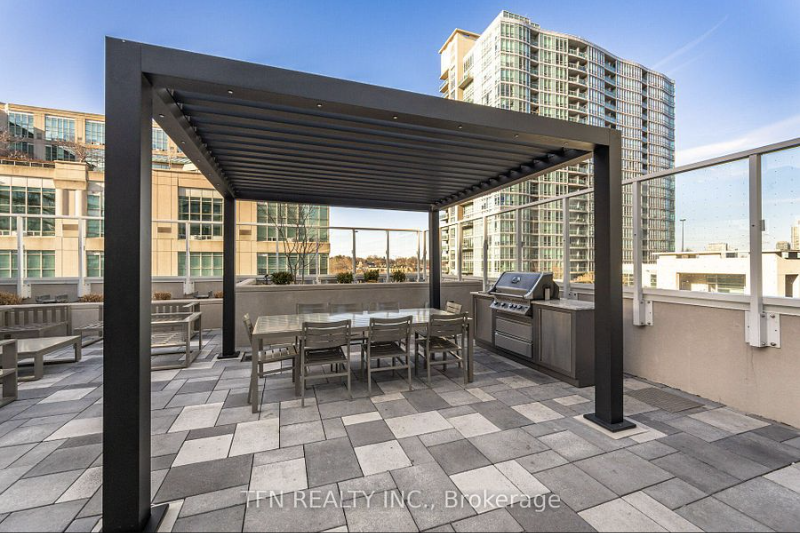
These images come from verified Empire Phoenix sold listings. They illustrate building context only and do not imply that every unit has the same finish, view or amenity relationship.

Empire Phoenix twin-tower exterior at 251 Manitoba Street
Empire Phoenix / 251 Manitoba exterior
251 Manitoba Street entrance at Empire Phoenix
251 Manitoba entrance
Representative sold-unit interior at Empire Phoenix
Representative verified sold-unit interior
Aerial context around Empire Phoenix and Grand Avenue Park
Aerial / neighbourhood context
Gym amenity from a verified Empire Phoenix sold listing
Gym amenity context
Outdoor rooftop amenity at Empire Phoenix
Outdoor rooftop amenity context

REALM listing photography from MLS® W11917373, W12317342, W12354970 and W13702134; source brokerage watermarks preserved. Images are descriptive context, not proof of market performance.

Empire Phoenix courtyard and building context

Mystic Pointe / South Etobicoke context

251 Manitoba belongs in the Manitoba–Legion comparison cluster, not a generic waterfront average.

Phoenix sits in South Etobicoke’s Mystic Pointe area, close to Grand Avenue Park and the wider Mimico / Humber Bay Shores condo district. Its newer construction, suite mix and amenity program differ materially from the older loft and condo stock nearby.

For unit-level valuation, I would start inside TSCC 2957. Only then would I widen to nearby buildings, with explicit adjustments for age, exact area, floor, exposure, parking, locker, fees and condition.

Buyer / owner due diligence

How I would compare two Empire Phoenix units.

1. Stay inside TSCC 2957 first. Newer nearby buildings and older Mystic Pointe lofts should not replace same-building evidence prematurely.

2. Match bedroom count and exact area. The repeated-product results show that one-bedroom and two-bedroom cells did not move identically.

3. Compare tower, floor and exposure. Two towers plus park/lake/city sightlines create unit-level differences inside one address.

4. Normalize parking, locker and condition. All verified parsed full sheets reported one parking space, but ownership/designation and locker details still belong in the unit comparison.

5. Read current corporation documents. Historical maintenance intensity is only a screen; current status-certificate evidence controls the due-diligence decision.

Methodology

How this Empire Phoenix analysis was built.

1. Scope. Fresh REALM exact-address searches isolated sold Condo Apt / Apartment records at 251 Manitoba Street for the same January 1-September 20 window in 2025 and 2026.

2. Address normalization. One record is entered as 251 Manitoba St S. Its broker full sheet verifies corporation 2957, so it remains in the same-building cohort rather than being dropped because of a board-entry suffix.

3. Full-sheet verification. All 16 sold broker sheets were re-opened. One 2025 sheet required a retry before corporation, exact area, maintenance, exposure, parking and sold date were accepted.

4. Product control. Common bedroom × reported-size strata are compared by median sold price, weighted by the smaller year count and combined with a weighted geometric mean.

5. Uncertainty. A deterministic 10,000-draw bootstrap of the matched estimator produced a 95% range of roughly -14.5% to -3.0%. The interval supports a softer matched-period signal in this sample, not a forecast.

6. Exact-area sensitivity. Exact $/ft² uses the full-sheet finished-area field only when populated. Coverage is four of nine in 2025 and seven of seven in 2026, so broad medians carry a coverage warning.

Sources & verification

Transaction evidence first; public sources for building identity.

FAQ

Questions buyers and owners ask about Empire Phoenix.

What did condos at Empire Phoenix sell for in 2026?

From January 1 through September 20, 2026, I verified seven sold Condo Apt records at 251 Manitoba Street. Their raw median sold price was $510,000 and median days on market was 56. These are matched-period building observations, not a valuation of a specific unit.

Did Empire Phoenix condo prices fall in 2026?

The raw matched-period median was about 4.7% lower. After matching primary bedroom count and reported size bands, the screening estimate was about 9.4% lower. A deterministic 10,000-draw bootstrap of that matched estimator stayed below zero, with a 95% range of roughly -14.5% to -3.0%. This describes this locked sample; it is not a forecast or an appraisal of every unit.

What was the price per square foot at 251 Manitoba in the sample?

Among sales with a populated exact reported finished area, the broad median was about $884 per square foot in 2025 and $852 in 2026. Exact-area coverage improved from four of nine sales to all seven sales, so that broad comparison is descriptive. A matched exact-area sensitivity across usable repeated product cells was about 6.1% lower.

How fast were Empire Phoenix condos selling?

Median days on market moved from 47 days in the 2025 matched window to 56 days in 2026. Four of nine 2025 sales sold within 30 days versus two of seven in 2026, while three sales in each year took more than 60 days.

What condominium corporation is Empire Phoenix at 251 Manitoba?

The verified resale evidence identifies the building as TSCC 2957. All nine 2025 full sheets resolve to corporation number 2957, and six of seven 2026 sheets do as well. One 2026 broker sheet reports TSCC / 0; that raw omission is preserved rather than silently rewritten.

Can I assume a buyer will negotiate 9.4% below last year's Empire Phoenix prices?

No. The roughly 9.4% decline is a historical bedroom-and-reported-size matched sample estimate at 251 Manitoba, not a specific unit appraisal or a suggested offer discount. Check the current property, same-layout completed sales, other live listings, condo expenses, condition and terms before making an offer.

Unit-level Empire Phoenix analysis

Comparing a condo at 251 Manitoba?

Send me the listing or unit number. I can narrow the evidence to the closest TSCC 2957 solds by exact area, bedroom/den layout, tower/floor, exposure, view, parking, locker, condition and current condo documents instead of applying one building average.

Provide at least one way to reach you.

Prefer to share your full buying criteria? Complete the buyer questionnaire →