MDMoh DianMohammad Hassan Mohammadian · Realtor®
Menu
Plan your move↗
Waterford Towers condominium complex on Lake Shore Boulevard West

Mimico waterfront complex intelligence · September 2026

Waterford Towers sold more slowly in 2026—and the one clean repeat pair also weakened.

The raw complex median fell about 19%, but suite mix changed sharply. The clearest comparable evidence is one repeated 2083 two-bedroom product with identical exact area in both years.

7 sales in 202510 in 20262083 · 2087 · 2095

Three addresses, one corporation and a thin price comparison

Waterford sales took longer in 2026. What does that mean for one specific lake-view condo?

Imagine a buyer attracted to a larger Waterford two-bedroom and an owner at a different address in the same three-tower complex. The historical combined median fell from $665,000 to $537,500, and selling time increased from 11 to 47.5 days. But the mix shifted toward smaller units. The cleanest same-product screen was just one 965-ft² two-bedroom sale at 2083 Lake Shore in each year: $850,000 versus $712,500. That pair matters, but it cannot set a rate for every Waterford tower. These are illustrative people, not active transactions.

For a buyer comparing Lake Shore condos

The 2083 repeated pair is relevant, not a blanket discount.

Both the 2025 and 2026 2083 two-bedroom sales reported 965 exact finished square feet, which eliminates one major size mismatch. Yet there is only one sale each year, and floor, lake view, parking and renovation still require comparison.

Next check: Identify whether the property is at 2083, 2087 or 2095 Lake Shore and match the exact physical product and exposure. Review current TSCC 1659 fees, status documents and comparable completed sales.

Know what to confirm in the corporation records →
For an owner considering resale

Slower historical selling is meaningful—but not a promise for your listing.

The 2026 cohort contained ten sales versus seven in 2025. More completed transactions took over 60 days, and median selling time rose from 11 to 47.5 days, but current marketing time still depends on your suite and price.

Next check: Check exact-tower same-layout competition, condition, views, parking and monthly carrying costs; budget different possible marketing periods and calculate realistic sale proceeds.

Assess costs and potential proceeds →

Three ways to use the Waterford data responsibly

  1. Does the comparable match the same address, bedroom count, exact area, floor, lake exposure, parking and condition?
  2. Are the reported selling-time differences based on historical closed sales or actual competing listings today?
  3. Do current common expenses and TSCC 1659 documents change the affordability of this suite?

The original 17 verified broker sheets, 7/10 historical completed-sale counts, three-address product separation and the one same-area 965-ft² pair are preserved. A 16.2% difference in one historical two-bedroom pair is not a statistically sound complex-wide depreciation rate or a guarantee of sale timing.

Matched-period snapshot

Pricing softened, but slower liquidity is the broader signal.

The complex raw median falls, the only exact repeated product also falls, and completed sales take materially longer in 2026.

7 → 10Matched-period sales
$665K → $537.5KRaw complex median · about −19.2%
11 → 47.5 daysComplex median DOM
−16.2%2083 repeat 2BR / 900–999 pair
5/7 → 10/10Usable exact-area coverage
17 / 17Sold full sheets reopened

Only one exact address + bedroom + size-band cell repeats across both windows, so the −16.2% matched result is a thin pairwise benchmark—not a precise complex-wide appreciation rate.

The main finding

The 2026 Waterford sample is smaller-suite heavy and materially slower.

6/7 → 4/10

Sales completing within 30 days.

1/7 → 4/10

Sales taking more than 60 days.

2087 turnover expanded

One sale in 2025 versus five in 2026, mostly smaller one-bedroom products.

2095 mix changed sharply

Two large/luxury 2025 sales versus one 953 sq. ft. one-bedroom in 2026.

The raw median decline is directionally consistent with weaker conditions, but the product mix prevents using −19.2% as a clean complex appreciation rate.

The one clean repeated product

2083 / 2BR / 900–999 sq. ft. fell from $850K to $712.5K.

Both sales report exactly 965 finished sq. ft., making this the strongest year-over-year pricing comparison in the locked sample.

2025 · 2083 Lake Shore$850,000
Product
2BR / 900–999
Exact area
965 ft²
Exact $/ft²
~$881
DOM
22 days
2026 · 2083 Lake Shore$712,500
Product
2BR / 900–999
Exact area
965 ft²
Exact $/ft²
~$738
DOM
25 days
Pairwise result−16.2%
Sold price
−16.2%
Exact $/ft²
−16.2%
Matched weight
1
Use
Thin but physically aligned benchmark

Because the exact finished area is identical, this pair does not have the within-band size problem seen in some other building analyses. Its limitation is transaction count: one sale per year.

Liquidity

Market time weakened much more broadly than the matched-price sample can prove.

The DOM shift appears across the larger complex cohort rather than depending on one repeated product.

11 → 47.5 daysComplex median DOM
6/7 → 4/10Sold within 30 days
1/7 → 4/10Sales over 60 days
16.5 → 66 days2083 raw median DOM
5 → 40 days2087 raw median DOM
41 → 17 days2095 raw median DOM · tiny sample

Exact area & carrying costs

Coverage improves in 2026, so broad $/ft² medians still need caution.

Two 2025 sheets genuinely leave exact finished area blank. No missing area is imputed.

5 / 7 → 10 / 10Exact-area coverage
~$876 → ~$735/ft²Broad raw exact-area median
~$1.30 → ~$1.42Observed maintenance / exact ft² / month
~+9.2%Observed maintenance-intensity median change

The broad exact-area median is descriptive only because coverage and suite mix change substantially. The repeated 965 sq. ft. 2083 pair remains the cleaner pricing benchmark.

Complex identity

Three Waterford addresses, one verified corporation.

Public building references describe Waterford Towers as a three-building complex at 2083, 2087 and 2095 Lake Shore, registered in 2005 with 284 units. The verified matched-period resale sheets consistently point to TSCC 1659 despite minor text-format inconsistencies in a few broker records.

2083Waterford high-rise
2087Waterford high-rise
2095Waterford boutique / luxury product
TSCC 1659Verified complex corporation

Visual context

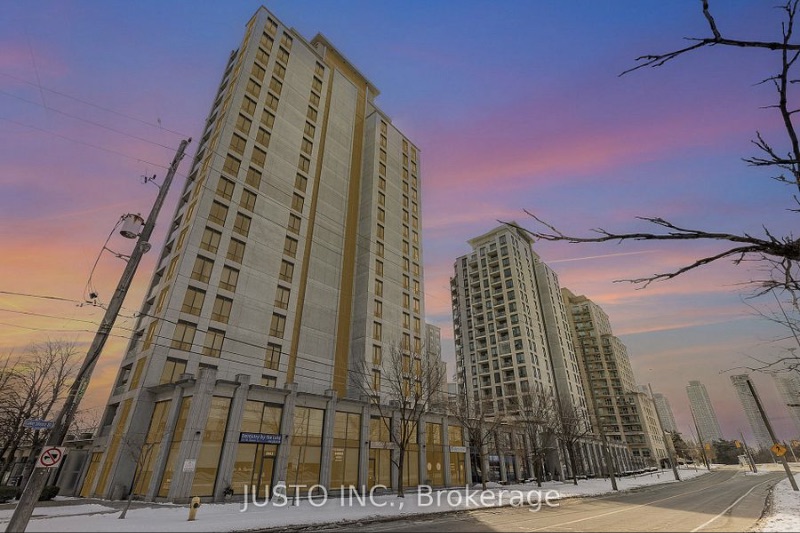
Waterford spans compact one-bedrooms through large waterfront luxury suites.

These preserved REALM images come from verified matched-period Waterford listings and show the complex’s wide product range.

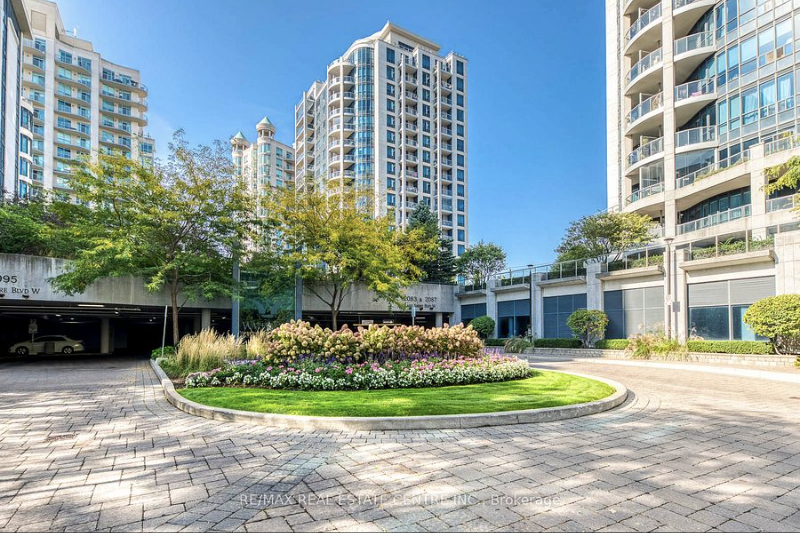
Waterford Towers landscaped complex entrance and high-rise buildings
Waterford Towers complex / landscaped approach
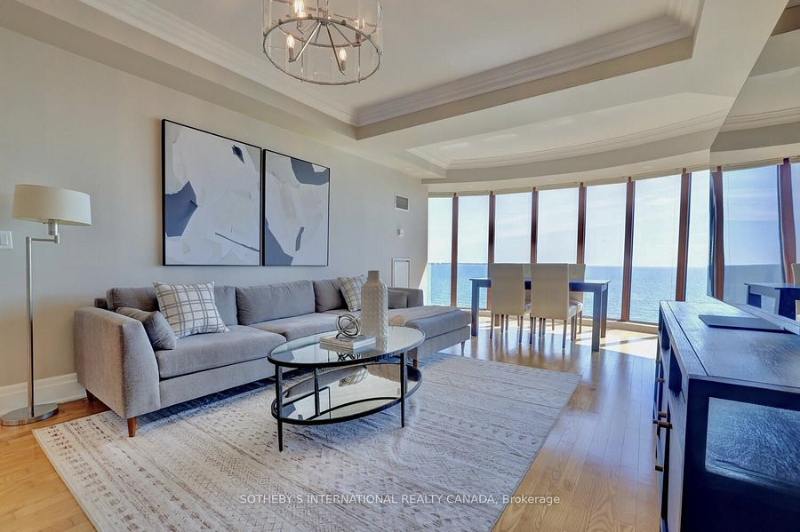
Representative luxury Waterford Towers condominium interior
Representative verified Waterford interior
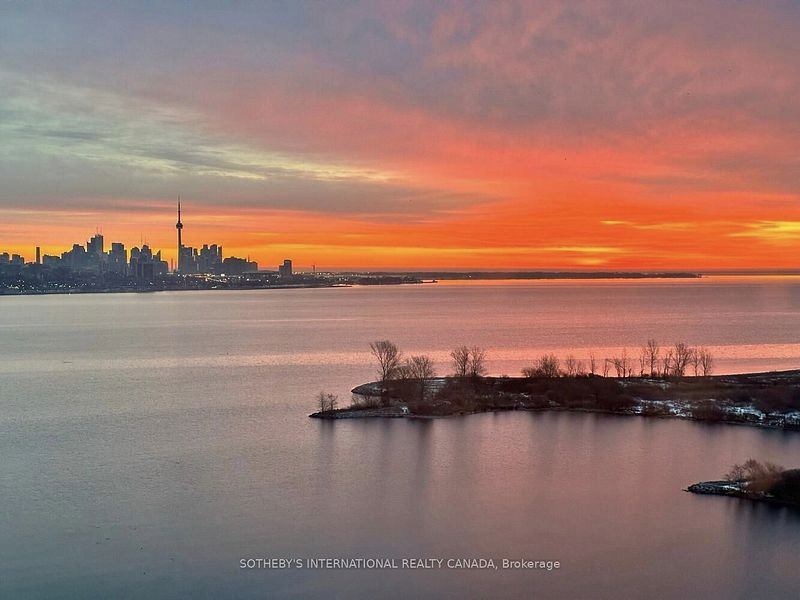
Lake Ontario and Toronto skyline view from a Waterford Towers listing
Representative lake / skyline view context

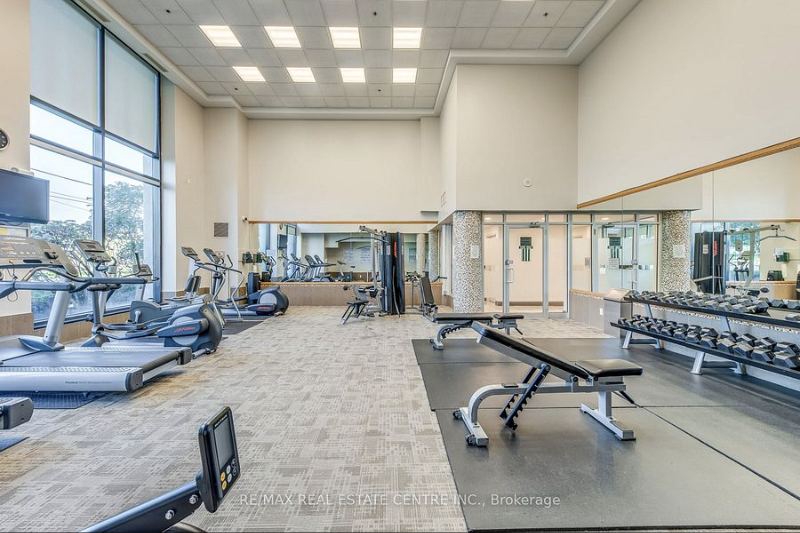
Preserved REALM listing photography from verified matched-period Waterford sales; original brokerage watermarks retained.

Fitness amenity at Waterford Towers

Mimico waterfront context

Established amenities beside the lake, with unit-level economics that vary widely.

Public references list concierge, pool, guest suites, gym/fitness, rooftop/BBQ and visitor parking. The verified sample ranges from compact one-bedrooms to multi-million-dollar luxury suites, so exact unit and current corporation documents matter more than a generic complex average.

Unit-level due diligence

How I would compare a Waterford condo.

1. Start with 2083, 2087 or 2095. The three addresses carry very different suite distributions in the matched sample.

2. Match bedroom count, reported size and exact finished area. Waterford’s product range is too wide for a complex median alone.

3. Compare floor, exposure and actual lake / skyline view. View quality can create major spread even inside a similar size band.

4. Verify parking, locker and condition. The higher-end 2095 product especially needs unit-specific comparison.

5. Review the current status certificate and fees. Historical observed maintenance intensity is only a screening input.

Methodology

How the Waterford Towers analysis was built.

1. Scope. Matching Jan. 1-Sep. 20 periods in 2025 and 2026 at exactly 2083, 2087 and 2095 Lake Shore Blvd W.

2. Product screen. All Condo Apt styles were pulled first, then the primary cohort was locked to single-level Apartment / 1 Storey-Apt records after broker-sheet review.

3. Date validation. Sale dates and exact addresses were explicitly rechecked after the REALM AI pull before any record entered the cohort.

4. Identity validation. The full sheets consistently support TSCC 1659 across all three addresses, despite minor text-format variants such as TSCP/TTCP in individual records.

5. Matched product. Only one exact address × bedroom × reported-size cell repeats: 2083 / 2BR / 900–999. Both sales report exactly 965 sq. ft.

6. Exact-area reconciliation. Exact area is usable for 5 of 7 2025 sales and all 10 2026 sales. Two 2025 blank fields remain blank; nothing is imputed.

7. Interpretation. The repeated pair suggests weaker pricing, while the larger and more stable evidence is the sharp slowdown in DOM across the complex.

Sources & verification

REALM transaction evidence first; public sources for complex identity and amenities.

FAQ

Questions buyers and owners ask about Waterford Towers.

What addresses are included in Waterford Towers?

This guide covers the three Waterford Towers addresses at 2083, 2087 and 2095 Lake Shore Blvd W. The verified matched-period records use TSCC 1659.

Did Waterford Towers prices fall 19% in 2026?

The raw complex median moved from $665,000 to $537,500, about 19.2% lower. But the product mix changed materially, especially at 2095, and 2026 contains far more smaller one-bedroom turnover. The raw median is therefore descriptive rather than a clean appreciation rate.

What did the closest repeated Waterford product show?

Only one exact address + bedroom + reported-size cell repeats across both matched windows: 2083 / 2-bedroom / 900-999 sq. ft. It sold for $850,000 in 2025 and $712,500 in 2026, about 16.2% lower. Both broker sheets report exactly 965 sq. ft., so the exact-area price-per-square-foot change is also about -16.2%.

Did Waterford Towers take longer to sell in 2026?

Yes in the locked sample. Median days on market moved from 11 to 47.5 days. Six of seven 2025 sales completed within 30 days versus four of ten in 2026, while sales taking more than 60 days increased from one of seven to four of ten.

How complete is the exact-area evidence?

Exact finished area is usable for 5 of 7 sales in 2025 and all 10 sales in 2026. Two 2025 broker sheets genuinely leave the exact-area field blank, and no area was imputed.

What do Waterford Towers maintenance fees generally include?

Public building references commonly list air conditioning, common elements, heat, building insurance, parking and water. Current fee amounts and inclusions must still be confirmed for the exact unit and current corporation documents.

Did Waterford Towers condo prices fall roughly 19% in 2026?

The mixed historical complex median was about 19% lower, but many different-sized units sold each year across 2083, 2087 and 2095 Lake Shore. One true repeated two-bedroom 965-ft² pair at 2083 moved from $850,000 to $712,500, but consists of only one transaction per year. Current unit value depends on same-product sales, floor, view, condition, fees and live competition.

Unit-level Waterford analysis

Comparing a condo at 2083, 2087 or 2095 Lake Shore?

Send me the listing or unit number. I can narrow the evidence to the correct Waterford address and closest solds by exact area, layout, floor, exposure, view, parking, locker, condition and current condo documents.

Provide at least one way to reach you.

Prefer to share your full buying criteria? Complete the buyer questionnaire →